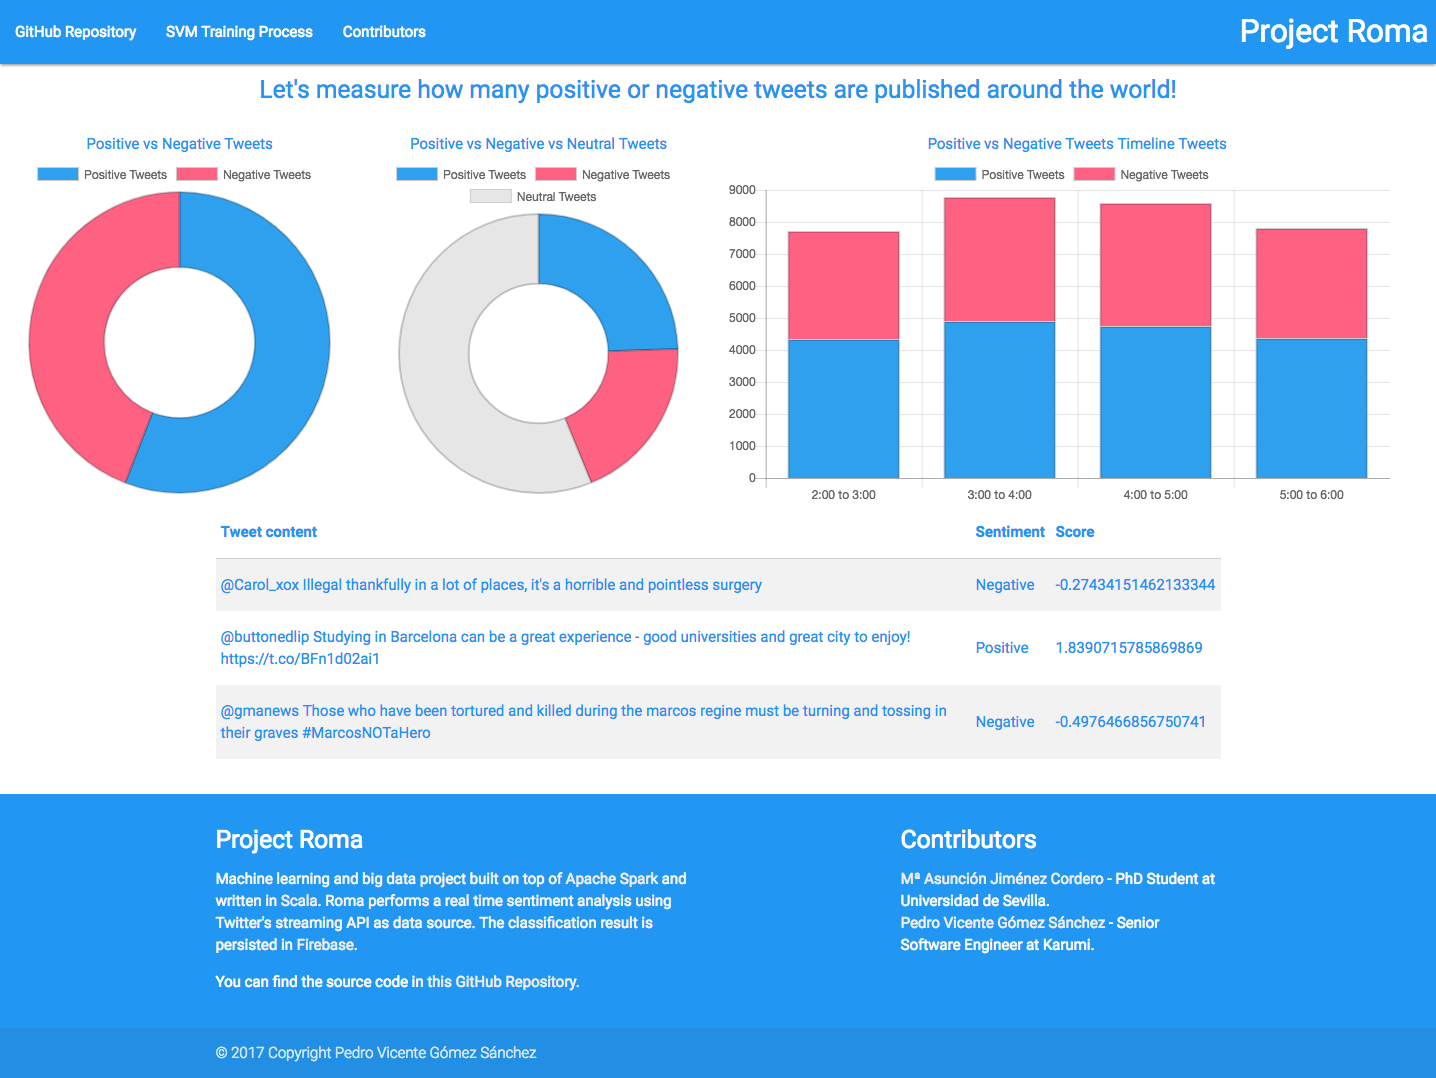
Weeks ago my Twitter timeline was full of negative stories. Angry developers fighting against JS and NPM, angry friends talking about the last football match and people complaining about politics. My timeline was so full of negative content that I started thinking Twitter was full of hate :_( That's why I decided to get some metrics to see if my intuition was right. With the help of Mª Asunción Jiménez Cordero, a PhD student specialized in Machine Learning, we developed a Spark application written in Scala to analyze real-time tweets and classify them as negative, positive or neutral using Support Vector Machine. In this post, we'll tell you how we developed this app in order to get the results you can find at https://pedrovgs.github.io/Roma/.
Let's split this post in the different challenges we faced!
Streaming
We wanted to analyze tweets in real-time, so we needed a framework to do this and, at the same time, support lots of data. To solve this issue we decided to use Spark in Scala. Spark, combined with Twitter4J allowed us to receive a distributed stream of tweets we could analyze in parallel when running on a cluster!

The classification problem
From the very beginning, we thought we had just two categories but we were completely wrong. The content of a tweet can be classified as positive, negative or neutral! So we needed to find how to classify raw text easily. Any conventional implementation based on the count of keywords was discarded from the very first time because of the problem structure. We started reading about sentiment analysis and some papers later, we discovered the solution had to be based on machine learning. We decided to use Support Vector Machine, a binary classification algorithm Mª Asuncion knows very well, and use the score obtained from the classification result to identify the tweet sentiment.
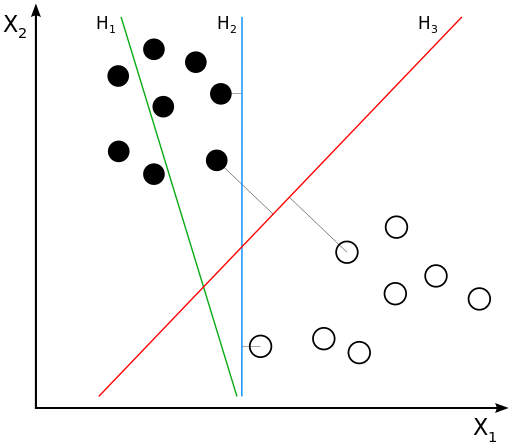
The usage of this technique is not that hard to understand if you simplify how it works. In a really simplified version of how SVM works, we could describe the algorithm as follows: SVM tries to find an hyperplane that separates the data into different categories. After extracting the content features (transforming raw text into a vector) we just had to apply this algorithm and review the results. SVM classifies our tweets and, for every item, provides us a score representing how far from the hyperplane the tweet was.
Training
The machine learning model we decided to use was a supervised strategy. This means we needed to train the model before using it with already classified tweets. To do this, we used a training dataset obtained from Sentiment140 composed of 1.600.000 already classified tweets for the training dataset and 400 tweets for the testing dataset. After the training, evaluating our model accuracy was fundamental. We just needed to use the already trained model with our testing dataset, and evaluate if the tweets classified as positive or negative were correct. Our first classification just got a 54 % of well-predicted tweets. At this point, we had the code ready to train the model, evaluate the accuracy and save the model for a future usage.
Improving the results was hard but the key to success in this project. As we couldn't improve our training dataset we decided to review how features were extracted. The steps followed to improve our features extraction and, as a consequence improve our classification results, were:
- Changing the algorithm used to extract features from Word2Vec to TF-IDF.
- Removing mentions.
- Removing links.
- Applying a stop words remover algorithm.
- Removing emojis.
- Removing hashtags.
- Removing consecutive chars.
- Removing symbols like: { , } ¢ $.
After improving our features extraction process we improved our model accuracy from 54% to 79.94%. Based on the testing dataset, about the 80% of the tweets were classified properly. We were really happy with the results we got after a bunch of hours coding.


Going to production
The model was trained and ready to classify. The streaming code was also ready and working. It was time to develop a simple web page to show the results in real time and run our Spark app in a cluster. To save the data and communicate with our servers we decided to use Firebase. Even when Firebase does not support aggregation and it's not the best database we could find it is free and we could use it to update our site easily in real time.
To run our Spark app we decided to create a Spark cluster in AWS and save our SVM model in S3. All the information needed to configure your own cluster and run the app can be found here. The website was deployed as a simple GitHub page using some javascript to update the changes in real-time using Firebase connectors.
Results
The process, starting from a point where we had no idea about machine learning or Spark to develop a real-time machine learning app in Scala, running on a cluster, was hard but totally worth it. Mª Asunción's machine learning support was the key to success in this project. I really appreciate it, thanks! You can review the results of a 4 hours classification in our site and run your own Spark app easily following the repository instructions :)
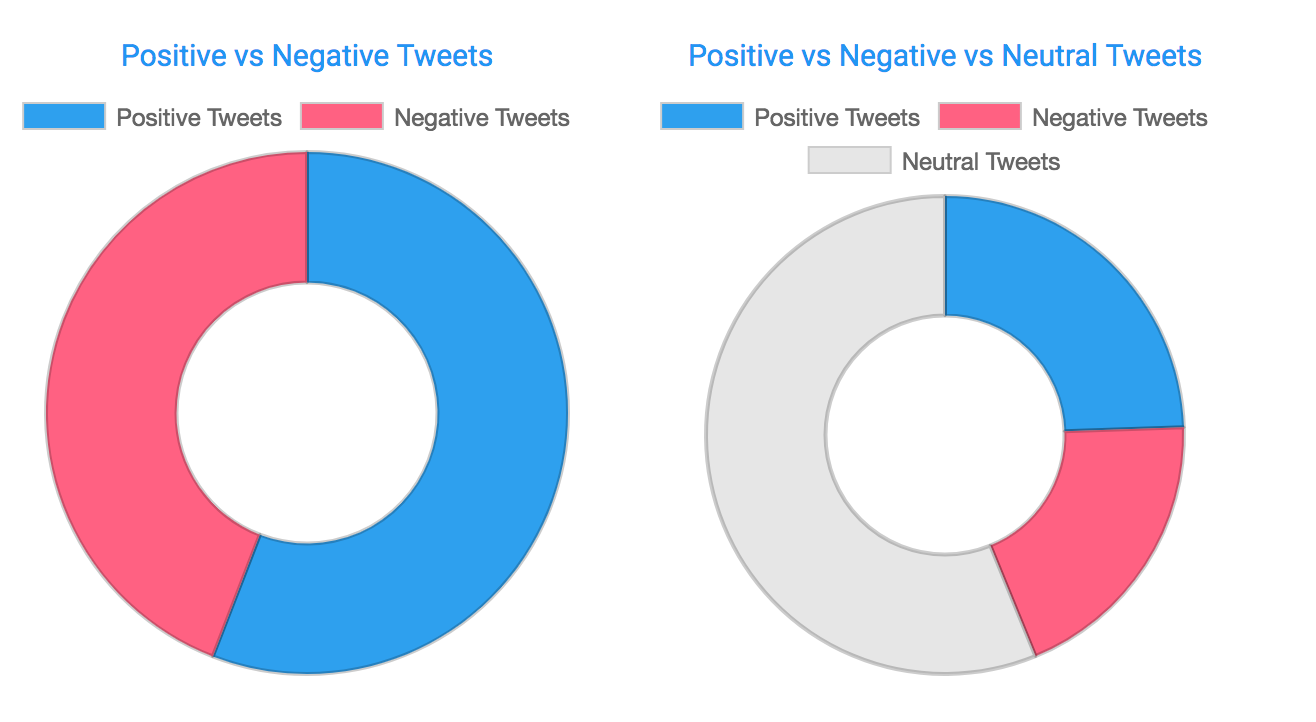
**About the tweets analysis and my initial intuition where I thought twitter was full of hate, I have to say I was completely wrong...**You can review the results! Most of the tweets published are neutral and the number of positive and negative tweets are really close to each other. I'm pretty sure the issue wasn't on my twitter timeline, it was me paying more attention to negative content or maybe having a bad day.