
As part of our daily tasks at Karumi, our team has to audit Android or iOS applications. Most of the time the audit is requested by a client who needs to get more insight about the app state. But one Friday at the office, Sergio and I had an idea. What if we take a look and measure one of the "big" apps?. And that's exactly what we did. We picked up the Twitter Android app, rolled up our sleeves and started working on it.
TL;DR
This is the list of dashboards with the Twitter Android performance metrics we got during the study:
- Android Home dashboard: General info about different metrics.
- User Interface: Frame time and frames per second of the different activities.
- Activity lifecycle: Activity lifecycle methods execution times.
- CPU consumption: CPU consumption.
- Memory consumption: Memory usage and bytes allocated by the application.
- Disk usage: Size of the folders associated with the database and cache folder and the shared preferences files.
- Network traffic: Uploaded and downloaded bytes.
Analysis
One of the key points we wanted to review was the app performance. The code quality is important, but that day we thought that reviewing the app performance could be more interesting. We were looking for answers to these questions: What is the app's frame rate? Is the CPU consumption high? What about the size of the internal storage? On the other hand, we'd like to share the results with you, sharing something interactive you could use and play around. How could achieve this goal? That's when an idea came to our mind... What if we could get a Twitter APK, inject some code inside, repackage the APK, install it into a device and collect all these performance metrics while using the app as a regular user?
The steps to follow were:
- Get an APK from Google Play or any other mirrors page like APK Mirror.
- Inject the FlowUp Android SDK code into the APK. Here you have documentation written by Sergio showing how to inject the FlowUp Android SDK data.
- Use the app for 1 hour as a regular user.
- Review the metrics and get some conclusions.
- Share the result and the dashboards information with you.
For this performance review, we used a Sony Xperia D5803 device. A Quad-core 2.5 GHz phone with a 4.6" display. We decided to use this device because most of the Android users don't have the new shiny Google Pixel device. This model specs are quite common. The APK used during the performance review is the one with version name 6.25.0.
We used the app as any average user would do. Post some tweets, review my timeline, open some tweets, write some direct messages, create a moment, mark some tweets as favorite and leave the application in background for some time. We used the app during one hour, we only had to review the results at the end of the execution.
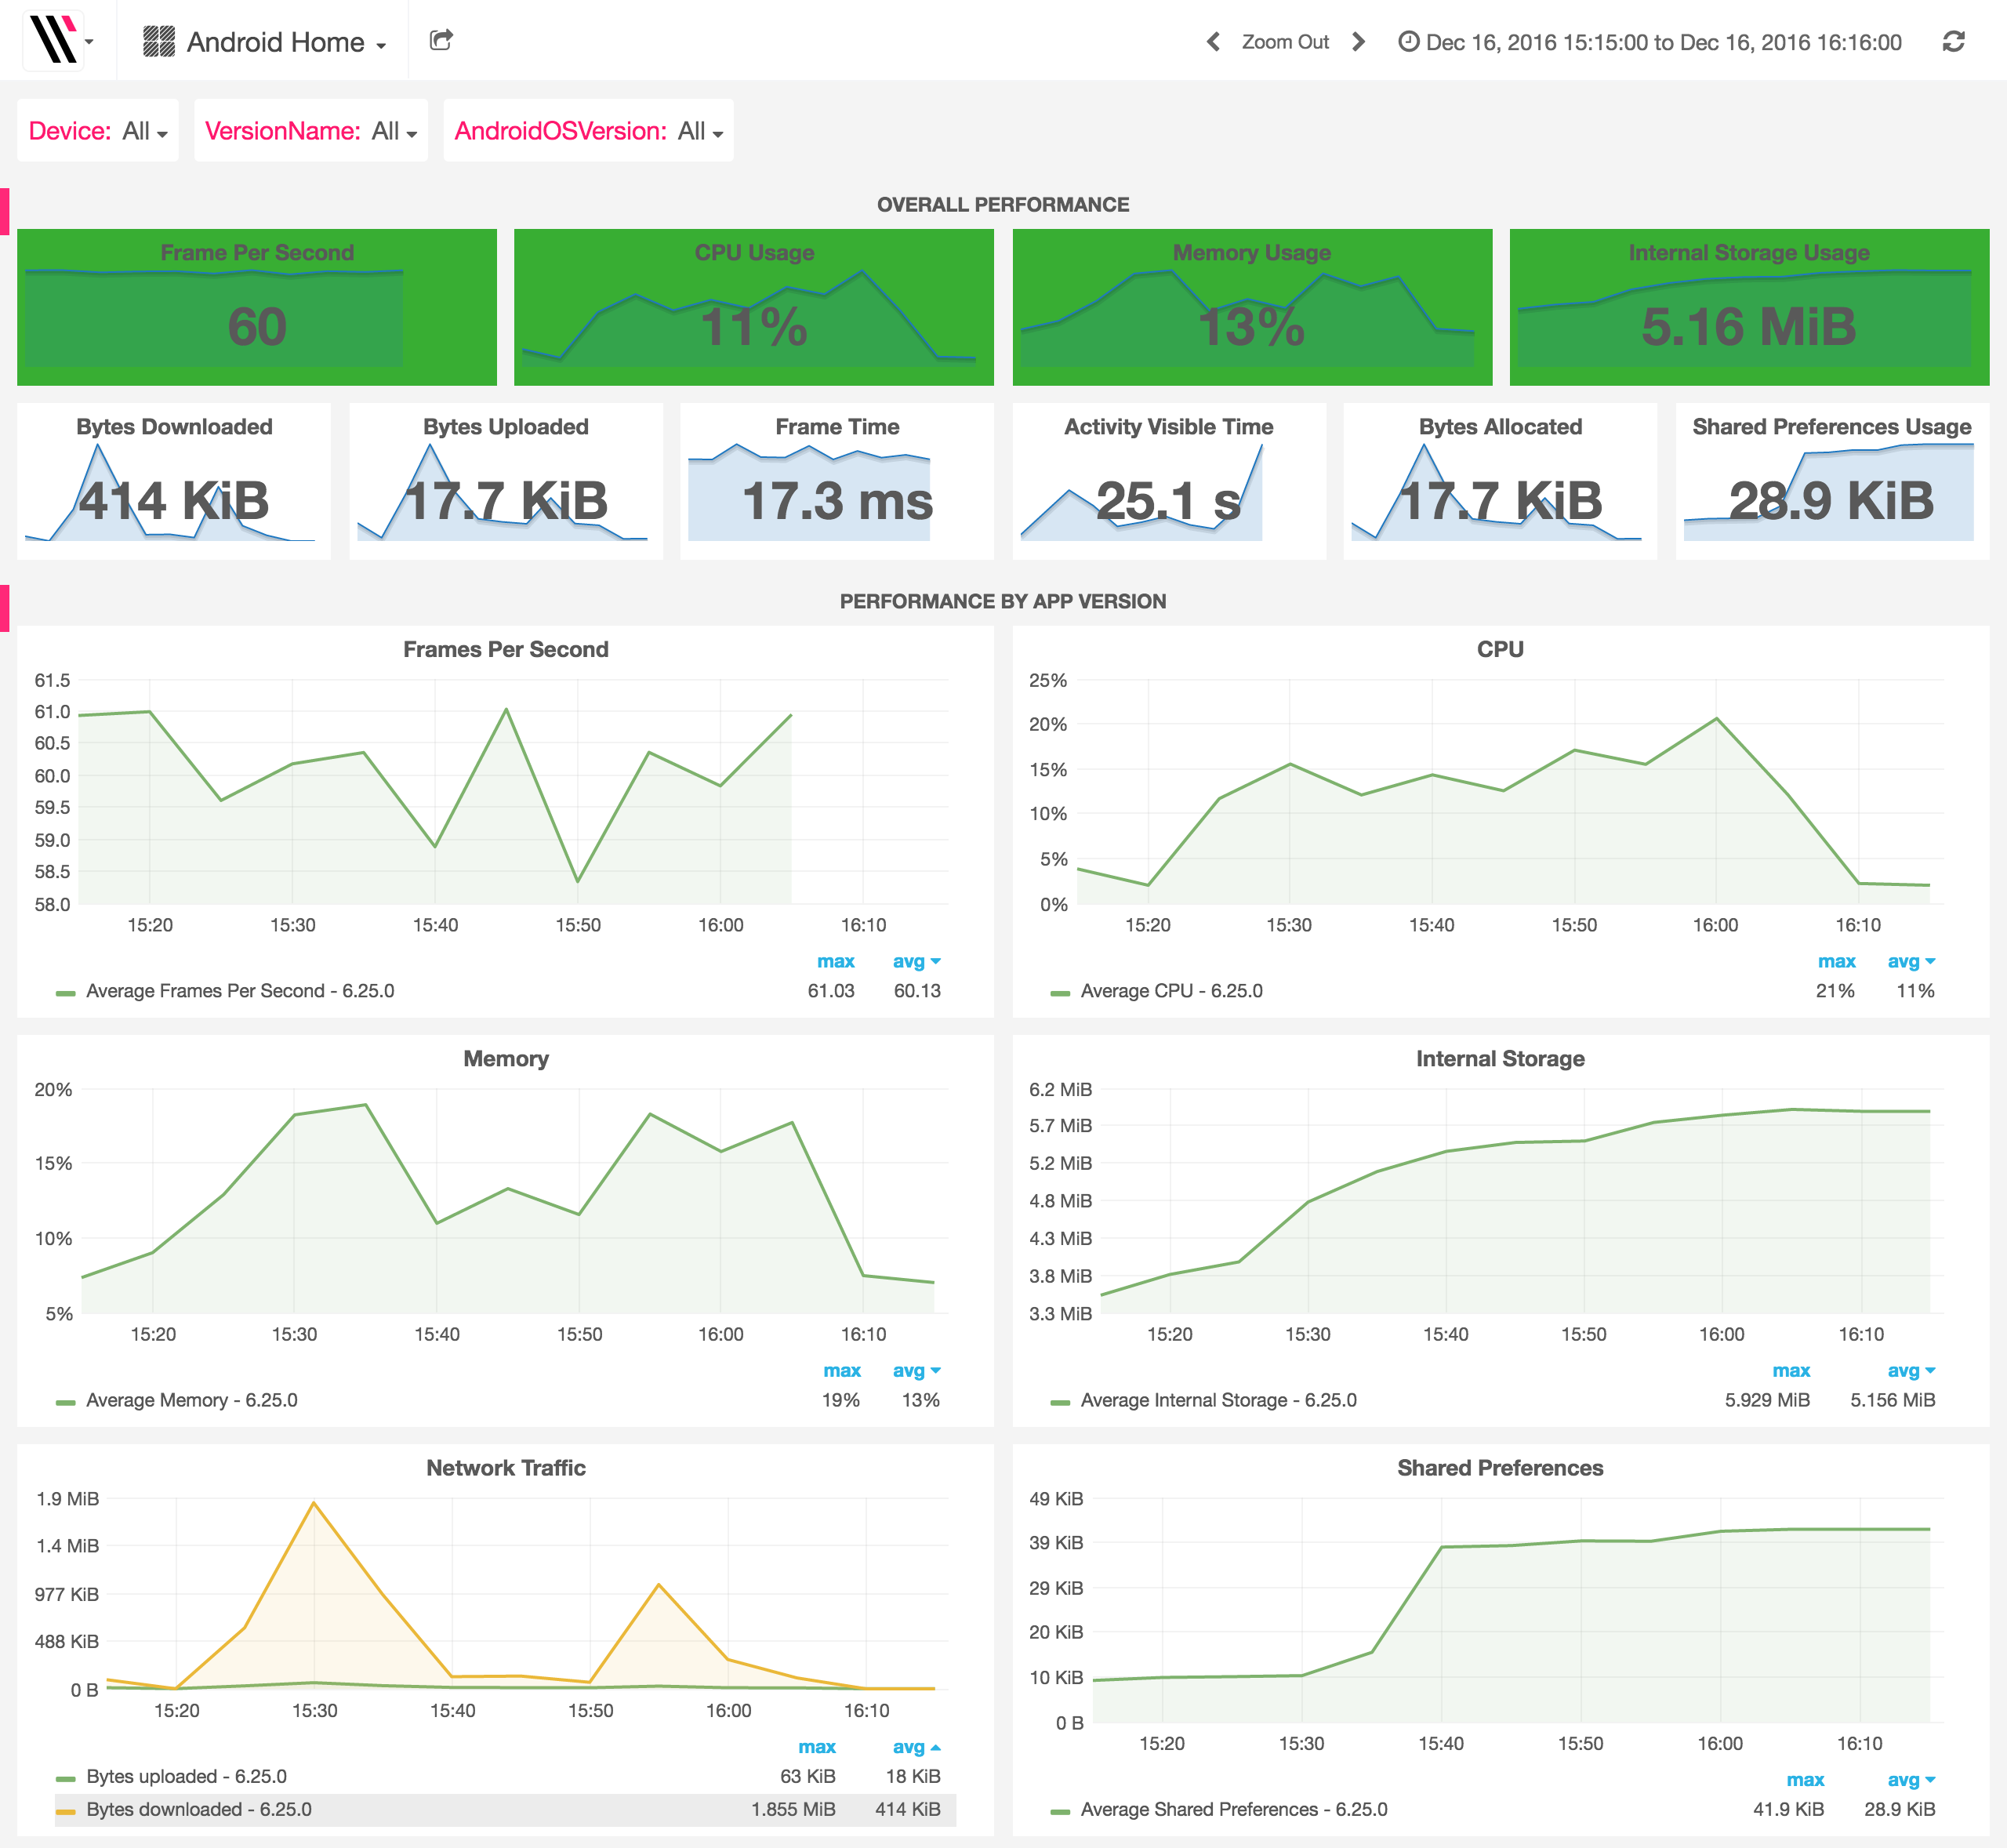
After reviewing the summary dashboard we realized that most of the metrics were almost perfect. The topics reviewed were:
- Application UI frame time: 60 fps as average, great! Even when we've been testing the scroll behavior with heterogenous lists and opening videos and gifs just to see if this could affect the app frame time.
- CPU usage: After a regular usage of the app for one hour reproducing multimedia files, posting tweets and scrolling to the past the average usage was 11 %.
- Memory usage: Rendering pictures, reviewing moments and the memory consumption was about 13%, 71.7 allocated MB as average.
- Shared references and internal storage usage: Even when we know all the information related to the tweets is persisted in a database and they are caching images on disk. The usage of the internal storage and the cache folder was around 5,16 MB and the shared preferences 28,9 KB.
- Network traffic: The network usage was 414 KB every 5 min as average for the download traffic and 17,7 KB every 5 min for the upload traffic.
This is a screenshot of the Android Home dashboard where you can see all this information:
If you want to take a closer look and play with the dashboards you can open the following dashboards we've prepared for you:
- Android Home dashboard: General info about different metrics.
- User Interface: Frame time and frames per second of the different activities.
- Activity lifecycle: Activity lifecycle methods execution times.
- CPU consumption: CPU consumption.
- Memory consumption: Memory usage and bytes allocated by the application.
- Disk usage: Size of the folders associated with the database and cache folder and the shared preferences files.
- Network traffic: Uploaded and downloaded bytes interval every 5 minutes.
If you take a closer look to the dashboards, you might notice some interesting details related to the app performance:
- Even when the frame time is great, the slowest activity is the one named
MomentMakerActivity. This activity is quite complex from the UI point of view and it's expected to drop more frames to be able to show it. - The maximum value associated with the
frame timemetric is 19,460.0 ms. This value was obtained scrolling the main feed really fast. As the list of tweets is full of heterogeneous UI elements, it is expected to have some frame time peaks while scrolling through it. - The
onCreatemethod is the slowest one. 102.8 ms as average execution time during the Activity lifecycle creation process. How is this possible? Because most of the slowest application code executed on the main thread should be invoked from this method. There is one activity namedTweetAnalyticsWebViewActivitywhich is quite slow to initialize. It needed 528 ms to execute theonCreatemethod. As you may know, web views are slow. - The CPU consumption is great, you can see how as we move around the app scrolling through different feeds and opening gifs we got 20% of the CPU usage but after that, the CPU stabilizes the usage around the 2%.
- There is a linear relation between the internal storage usage and the shared preferences usage. This could be related to any information being persisted on the SQLite database using the shared preferences to persist some metadata.
- The memory usage is always below the 20% and the 95MB allocated. If we review the usage of the app scrolling around a lot of tweets with images and links with images associated, opening other activities and so on. This is the expected behavior. Based on this data we could assume the size of the heap is about 540MB which is quite high and could be related to the usage of the param
largeHeap.
We spent a bunch of hours reviewing the app performance and at the end of the exercise we pondered whether we could improve the data and the analysis performed. Deploying a version of Twitter using this SDK we could get the same information but crossed by a lot of different metrics like device model, version of the app, Android OS version, number of cores, if the app is in background or foreground and much more. And if we had got access to the source code we could know more about the conclusions we faced before.
If you want to review other dashboards monitoring an Android Launcher implemented by the 47Deg team you can take a look here.
It was really interesting and fun reviewing the performance associated with such a great project as Twitter's Android app. We'd like to congratulate the whole Twitter Android team for such a great app. Maybe in a future blog post we could review any other app :).