
One aspect of our core tasks as Software Engineers at Karumi is to improve already published apps or help teams develop new apps. One week ago we found out that the application we were working on had an issue, but we had no idea where the bug was and we needed to urgently develop new important features. Simultaneously, some of the users posted app reviews in Google Play complaining about the performance of the app’s user interface.
- "Since the last version, it's really slow. One star."
- "The full-screen image takes too long to open."
- "After 20 minutes using the app it's impossible to see my favorites screen."
It was crystal clear that we had a performance issue. The number of "one-star" reviews was increasing and we had to make a decision, quickly. There were two possibles courses of action: 1) Continue adding new features, as requested by the product team, or 2) Stop further development and solely focus on fix the bug. Before jumping into a quick decision, we gathered some input data to help us better evaluate the scenario at hand. To this end, instead of trying to hunt the bug, we took a look at Crashlytics and a new SDK we integrated the week before, FlowUp.
Sadly, the Crashlytics report did not provide with new insights about our app performance. We found the exact same crash free ratio as compared to the previous week and the known crashes from the previous versions -that we never had time to fix-.
On the bright side, FlowUp came to save the day. FlowUp is a real-time performance monitoring platform for Android and iOS we are currently developing at Karumi. Using this SDK we could get ahold of a wealth of useful information about our application performance by just simply including the library and adding one line of code in our Application class.
FlowUp.Builder.with(this).start(API_KEY);
FlowUp help us make the decision based on numbers and data rather than gut feelings. Prior to committing to a course of action such as adding a new feature or fixing the bug, we decided to take close look at the FlowUp dashboards, packed with a myriad of key app performance data points.
Looking at the Android Home dashboard, we discovered we had a problem with two metrics, the memory usage and the frame time.
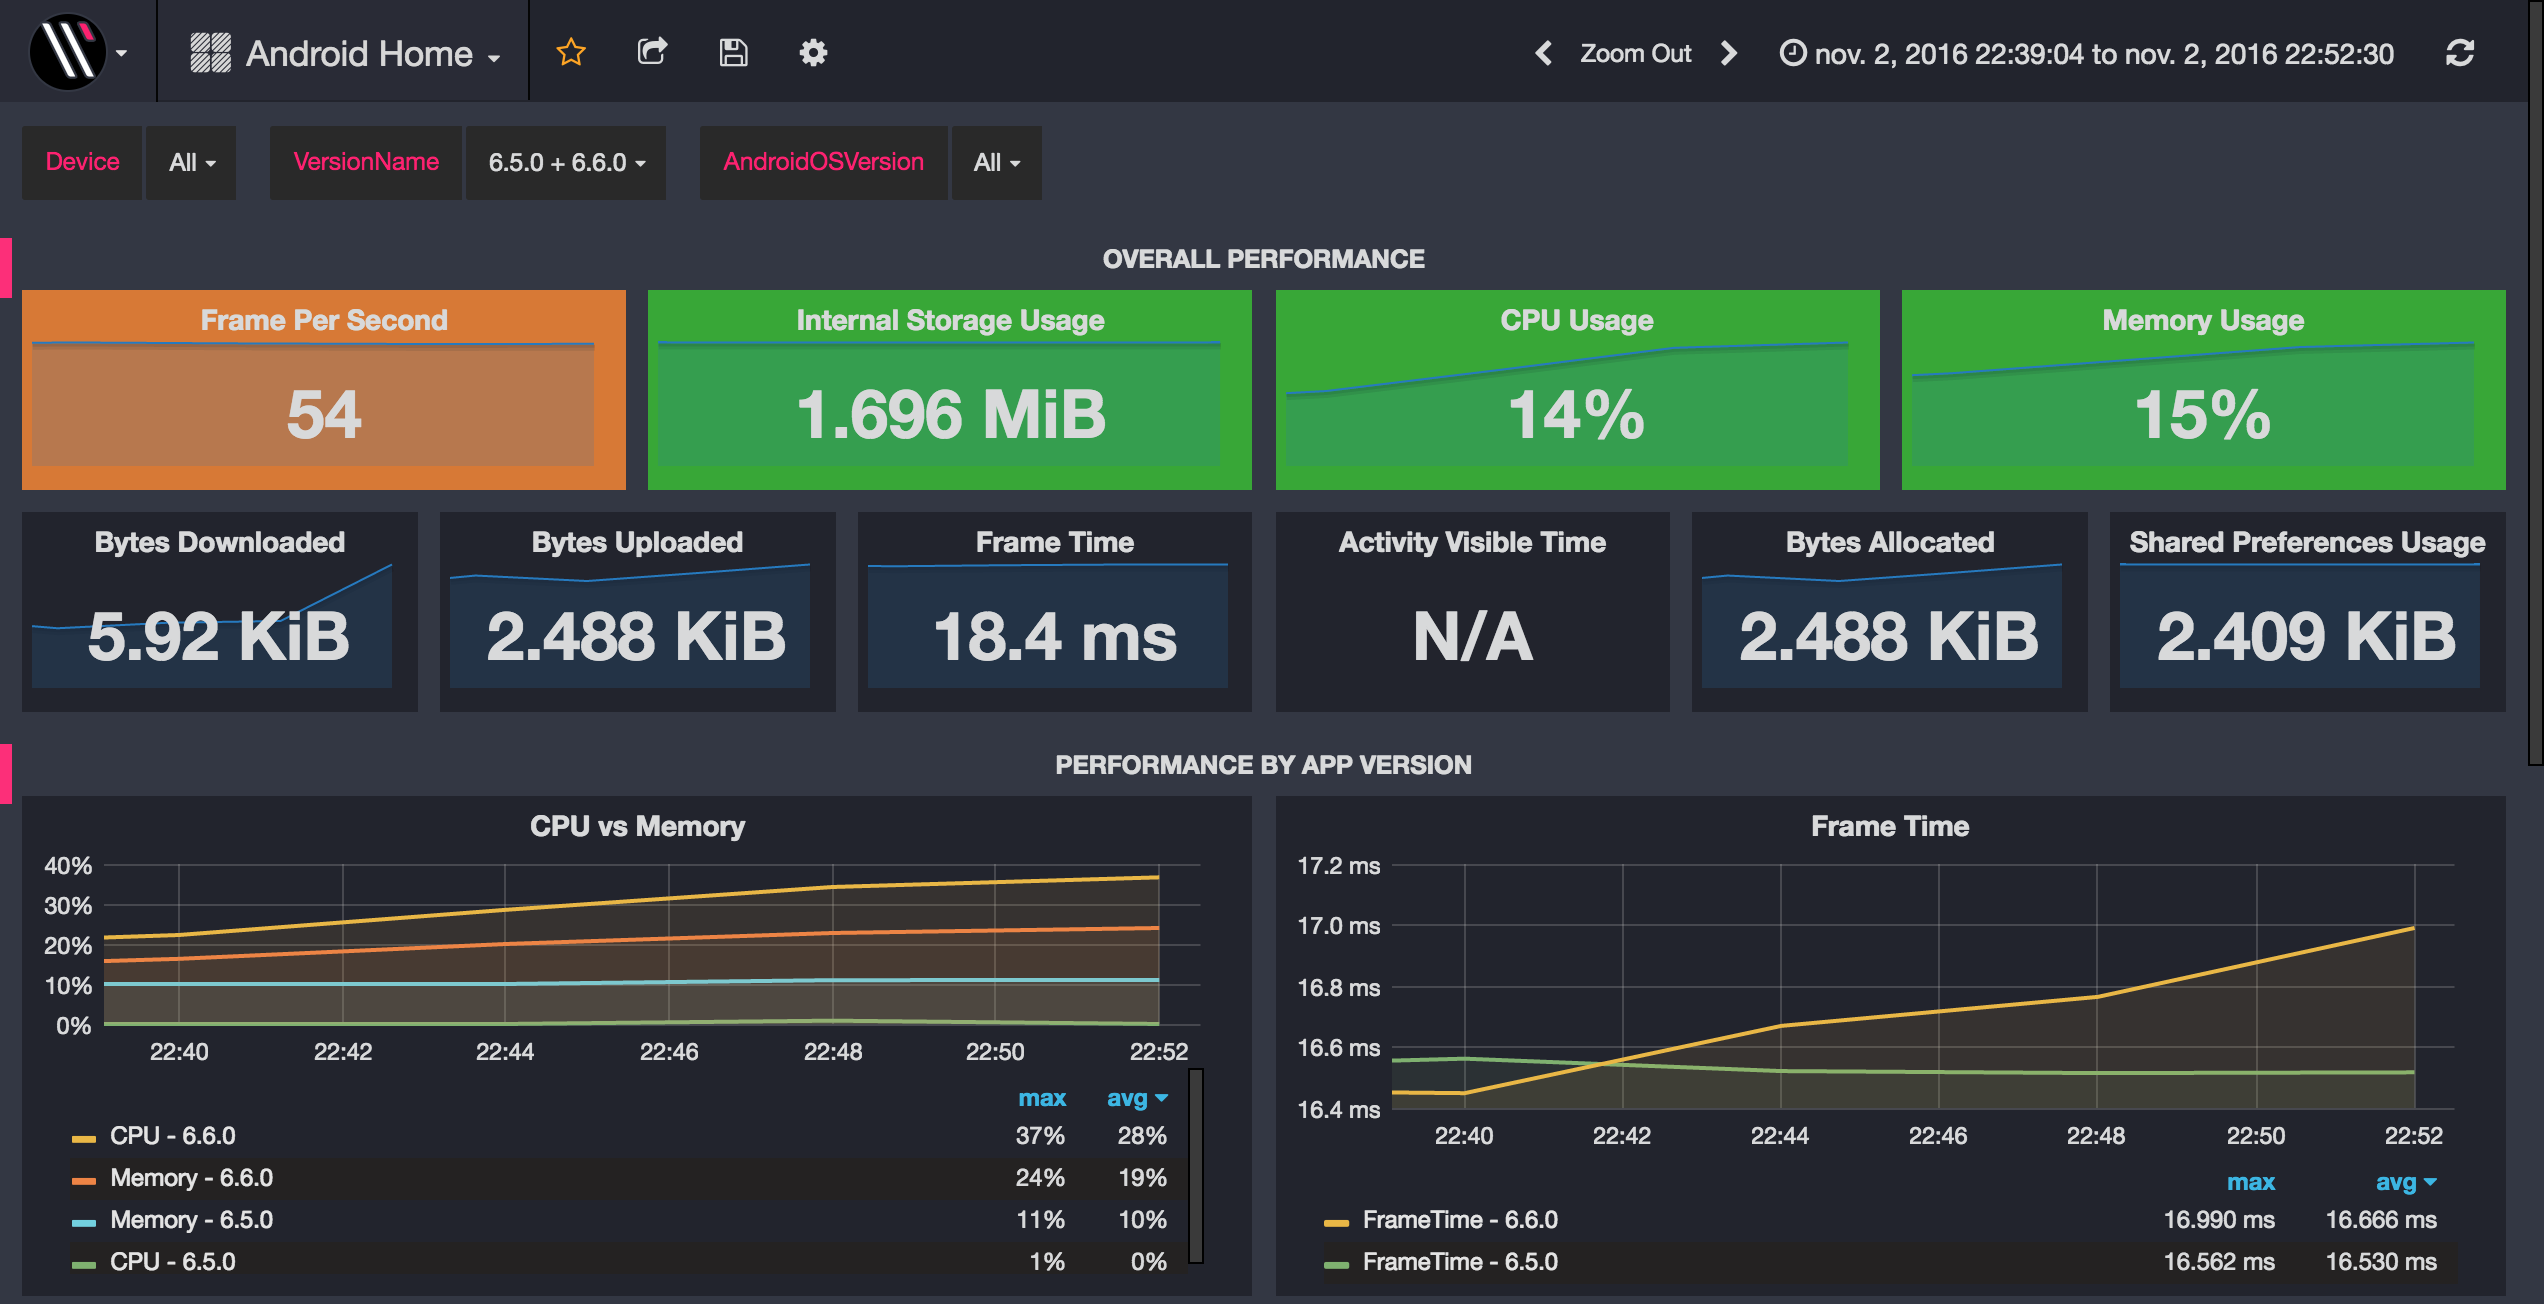
In this dashboard, you can clearly spot how the number of frames per second is 54 and the frame time is close to 17 milliseconds for version 6.6.0. Meanwhile, in version 6.5.0 the frame time was close to 16.5 ms. The memory consumption and the CPU usage was also better in version 6.5.0.
Taking a careful look to the Memory dashboard and the User Interface dashboard we found some issues:
- The memory usage was too high, about 25% for the new version.
- The app was allocating too many bytes.
- The frame time was close to the 17 milliseconds for the latest version. However, the previous one was rendering a frame in 16 ms.
- The number of frames per second was worst in the new version too.
At this point, it was obvious we had a problem. In order to identify what the problem was, we decided to start monitoring two devices we had under control. We chose two devices reporting the same metrics values with the same app version in order to avoid different metric values generated by the device.
Ideally your application should get a frame time close to 16 milliseconds to be able to render 60 frames per second. Why 60 fps? In terms of memory, if your application consumes more than the 50% of the heap associated to the application process, there is something wrong going on. You could potentially have a memory leak causing the high values associated to the memory usage.
Scrolling down through the Android Home, Memory and User Interface dashboards we could compare the metrics filtered by different cross-metric information:
- Application version name.
- Android OS Version.
- Device model.
- Screen name.
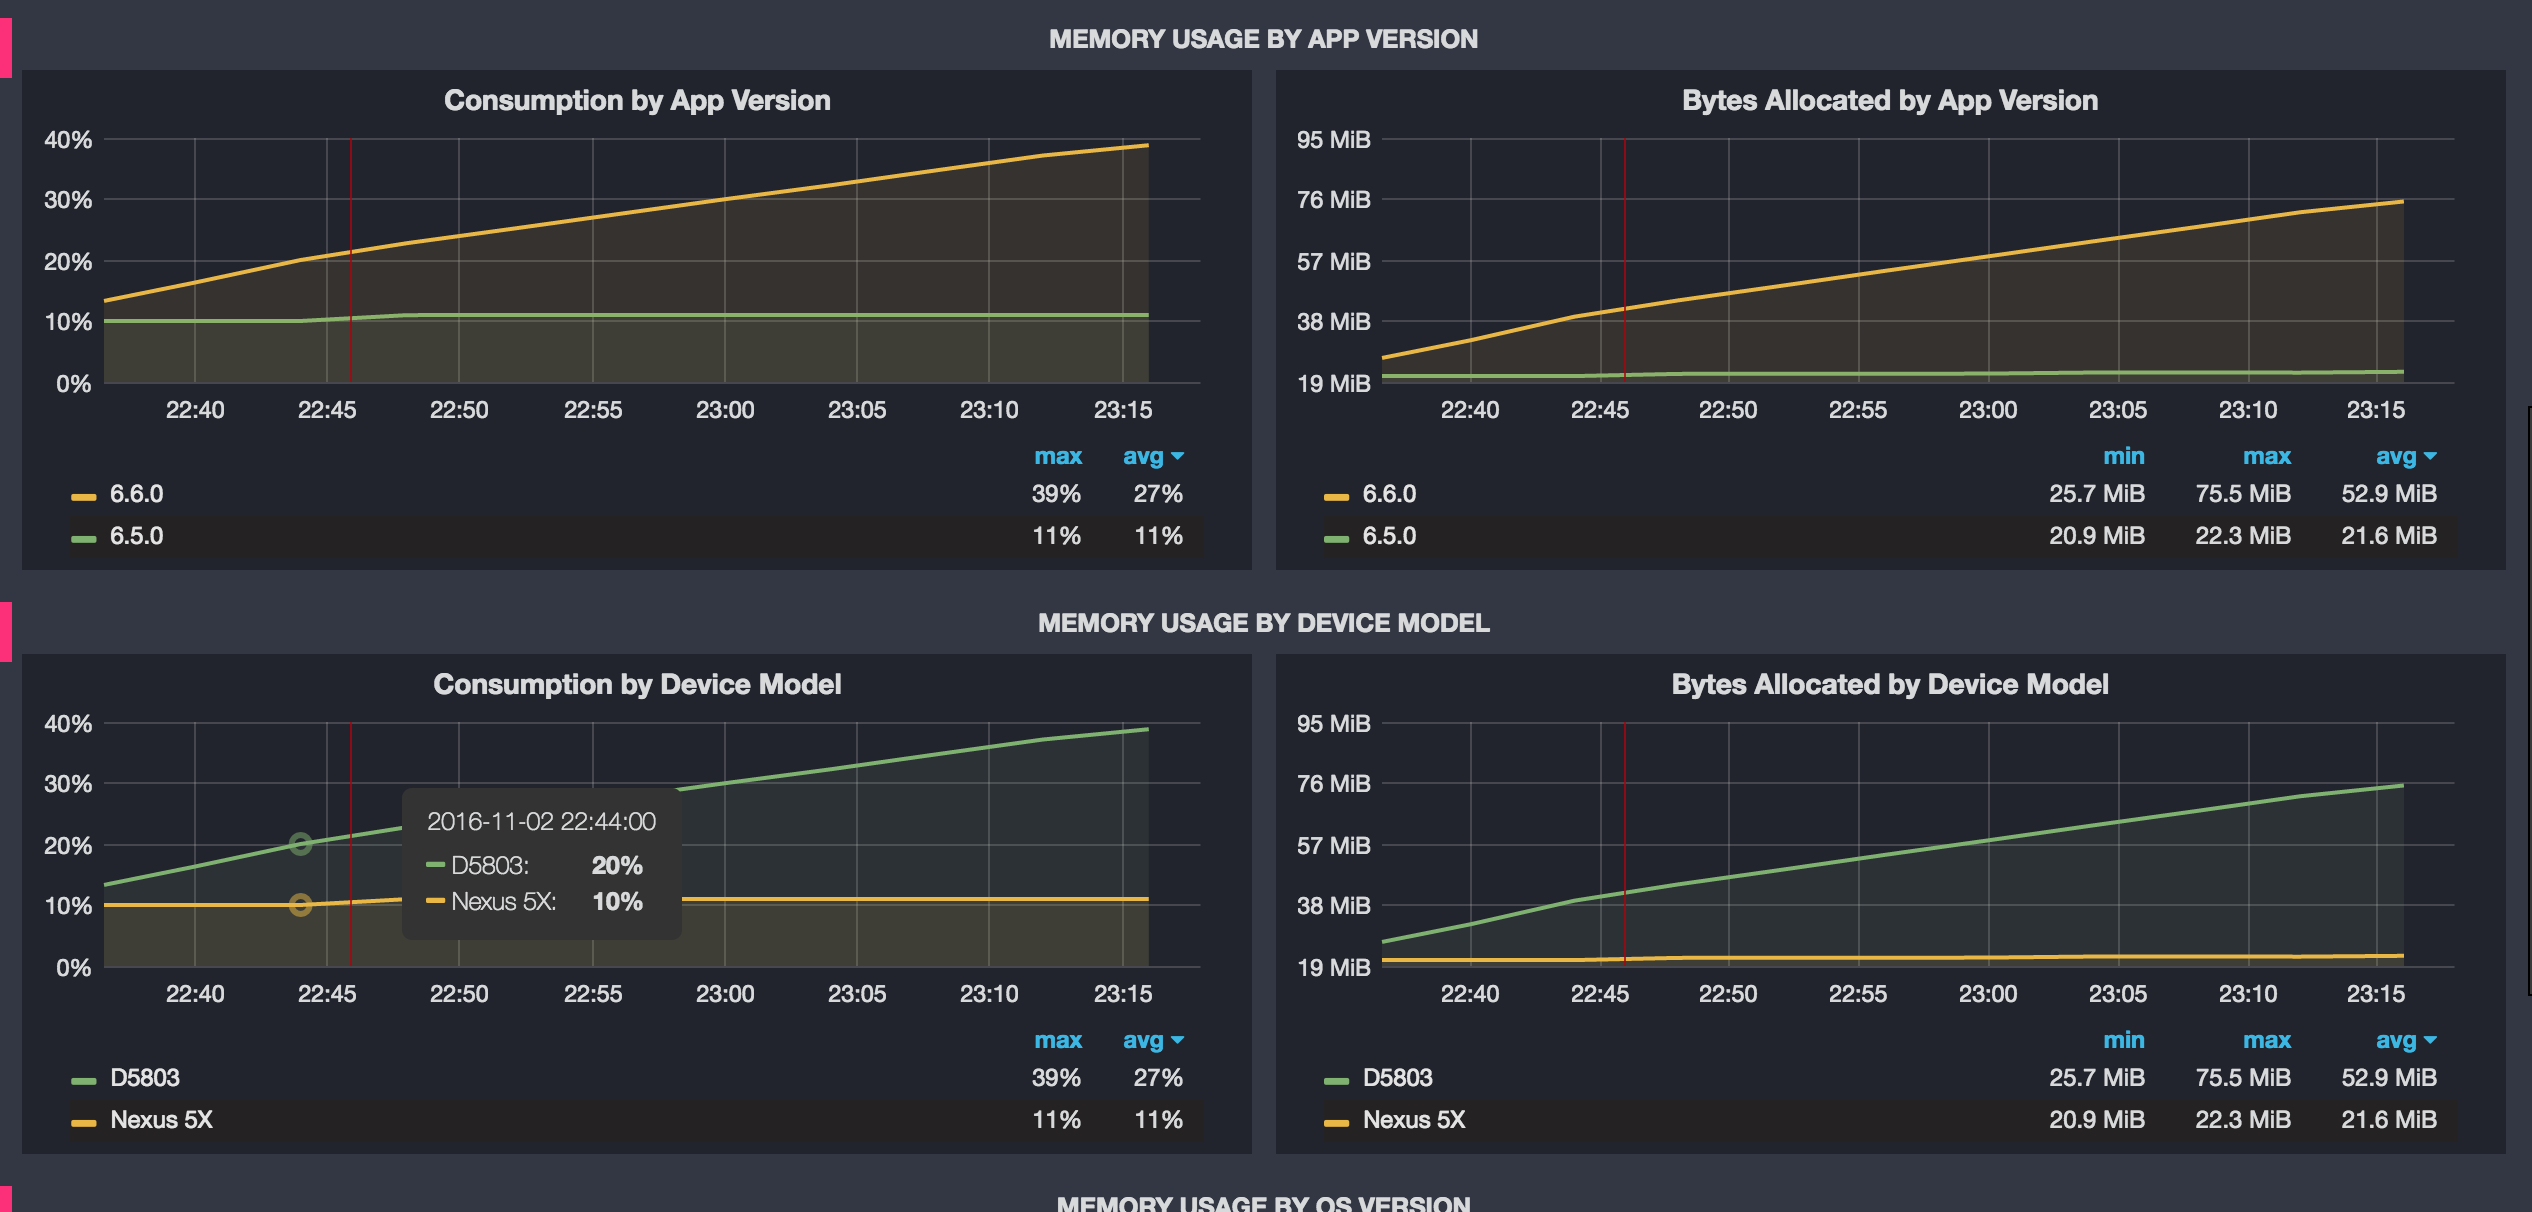
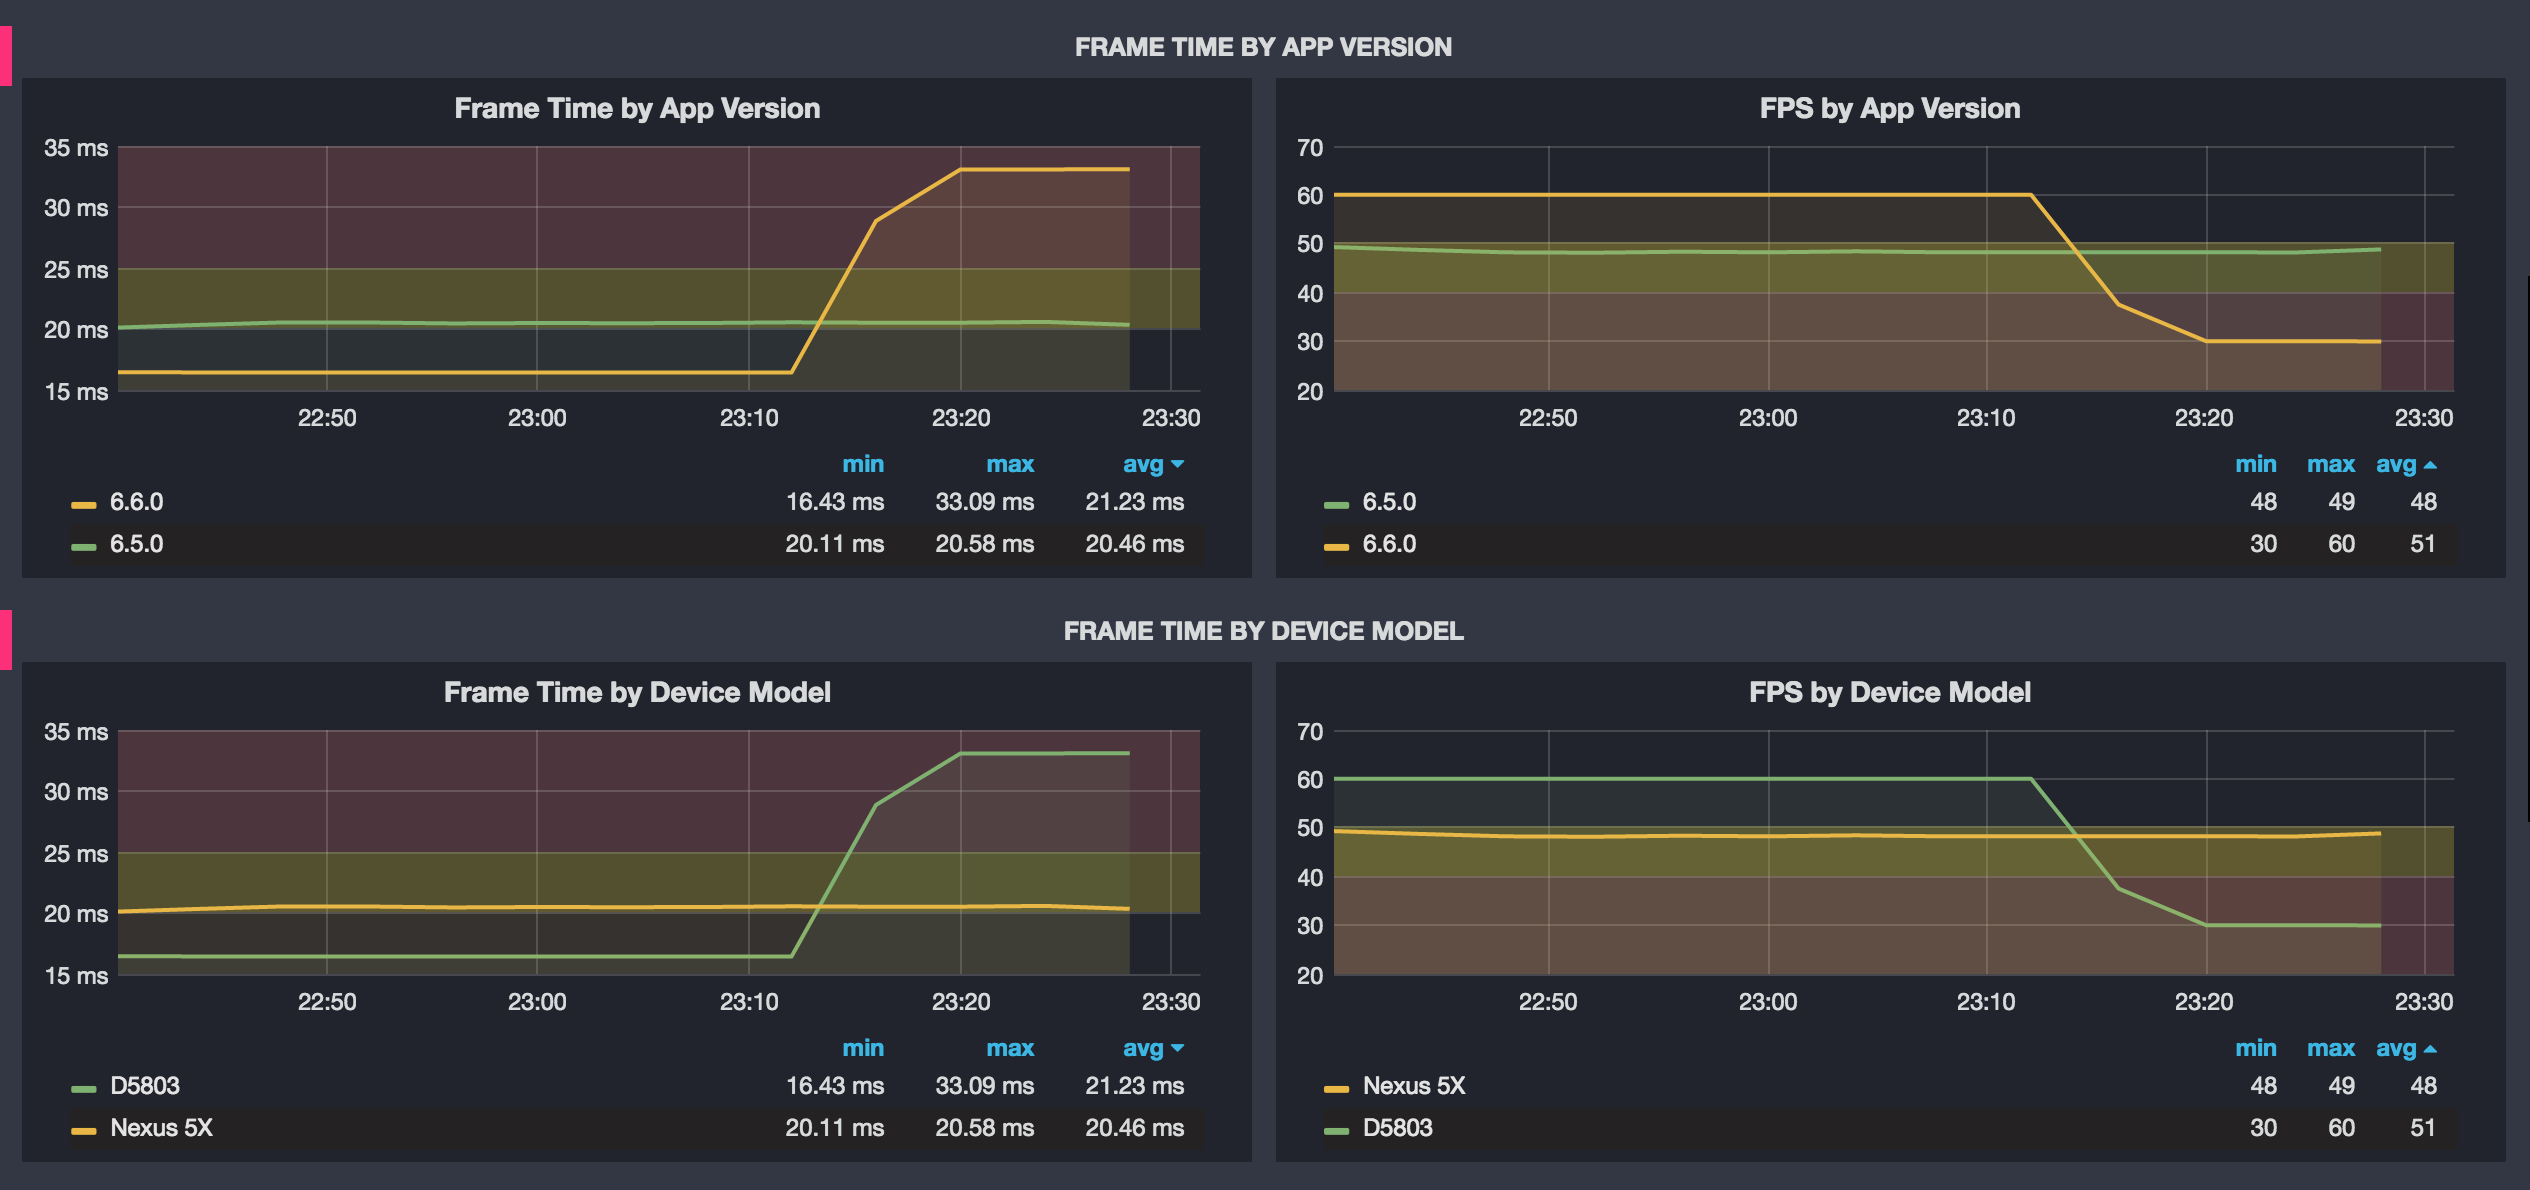
As shown in these graphs, we can see how the memory usage and the frame time was unusually bad for version 6.6.0. In the case of the frame time, the metric was bad only at some point in time and not from the very beginning. We will explain this point later. The Nexus 5 had installed the version 6.5.0 and the D5803 the version 6.6.0. We realized that the frame time performance was worse than in the previous version.
Did we introduce a bug in the last version we published a week ago? We could find the problem easily filtering by version name. It only took 10 minutes to look at the dashboards and find out that we had released a version with a new bug, causing a performance issue. This performance issue was affecting every user with this newest version installed. As we were degrading the application quality for every application session using the latest version, instead of continue adding features we decided to fix the bug and publish a hotfix right away.
Once the course of action was clear, it was time to locate the bug. After reviewing all the changes introduced in the latest version, we discovered that we had a new custom view in our main screen: an audio player. It seemed the perfect candidate. Looking at the custom view code, we realized that during the onDraw method there was an object being instantiated inside a private method and stored in a list without being removed later.
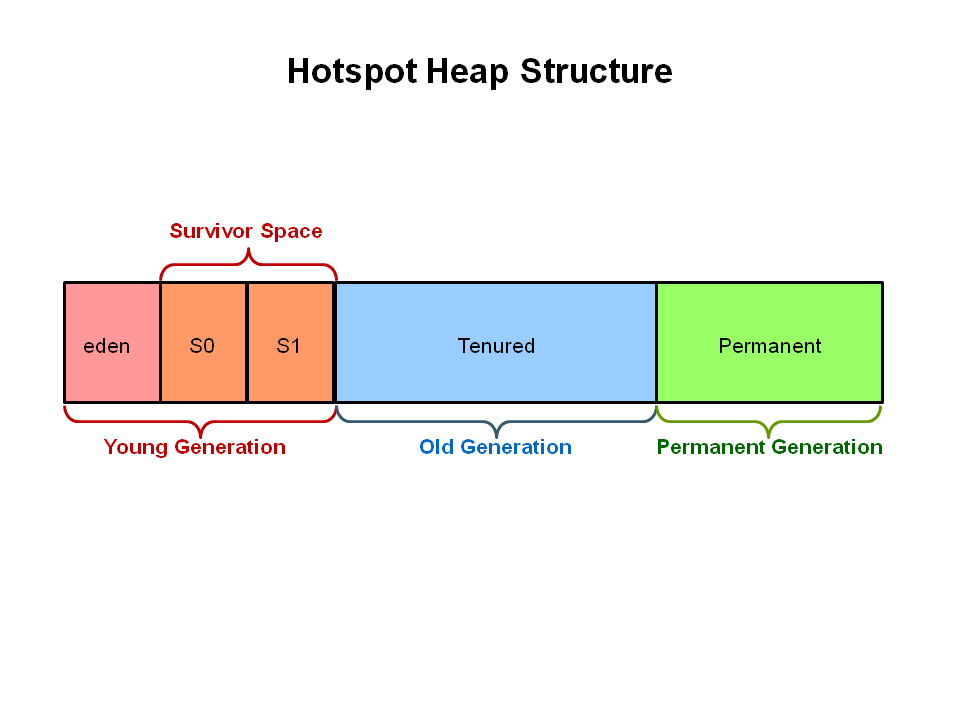
This method was allocating an instance every time the onDraw method was invoked. As the view was being invalidated continuously, the number of instances created was huge. Remember that the Android garbage collector is based on a generational implementation (like the Java 1.5 versions). This means that every time a generation is full, the garbage collector stops every single thread to collect the non-referenced memory and, depending on the generation, fragments the different generations. This garbage collector events are named stop the world, meaning that even the UI thread has to stop to be able to collect memory. Keep in mind that the Android garbage collector can't work in parallel.
Why couldn't we see this in Crashlytics? Because the memory was increasing so slowly that only the users with the app opened for some minutes had this performance issue. Just a bunch of users had the app opened so long that the bug ended with an OutOfMemoryError. And the crash trace we could see related to an OutOfMemoryError was not in the Activity with the custom view bug. I have to say that the Android team developing the app uses the app, but not for as long as most of our users does. Our bad.
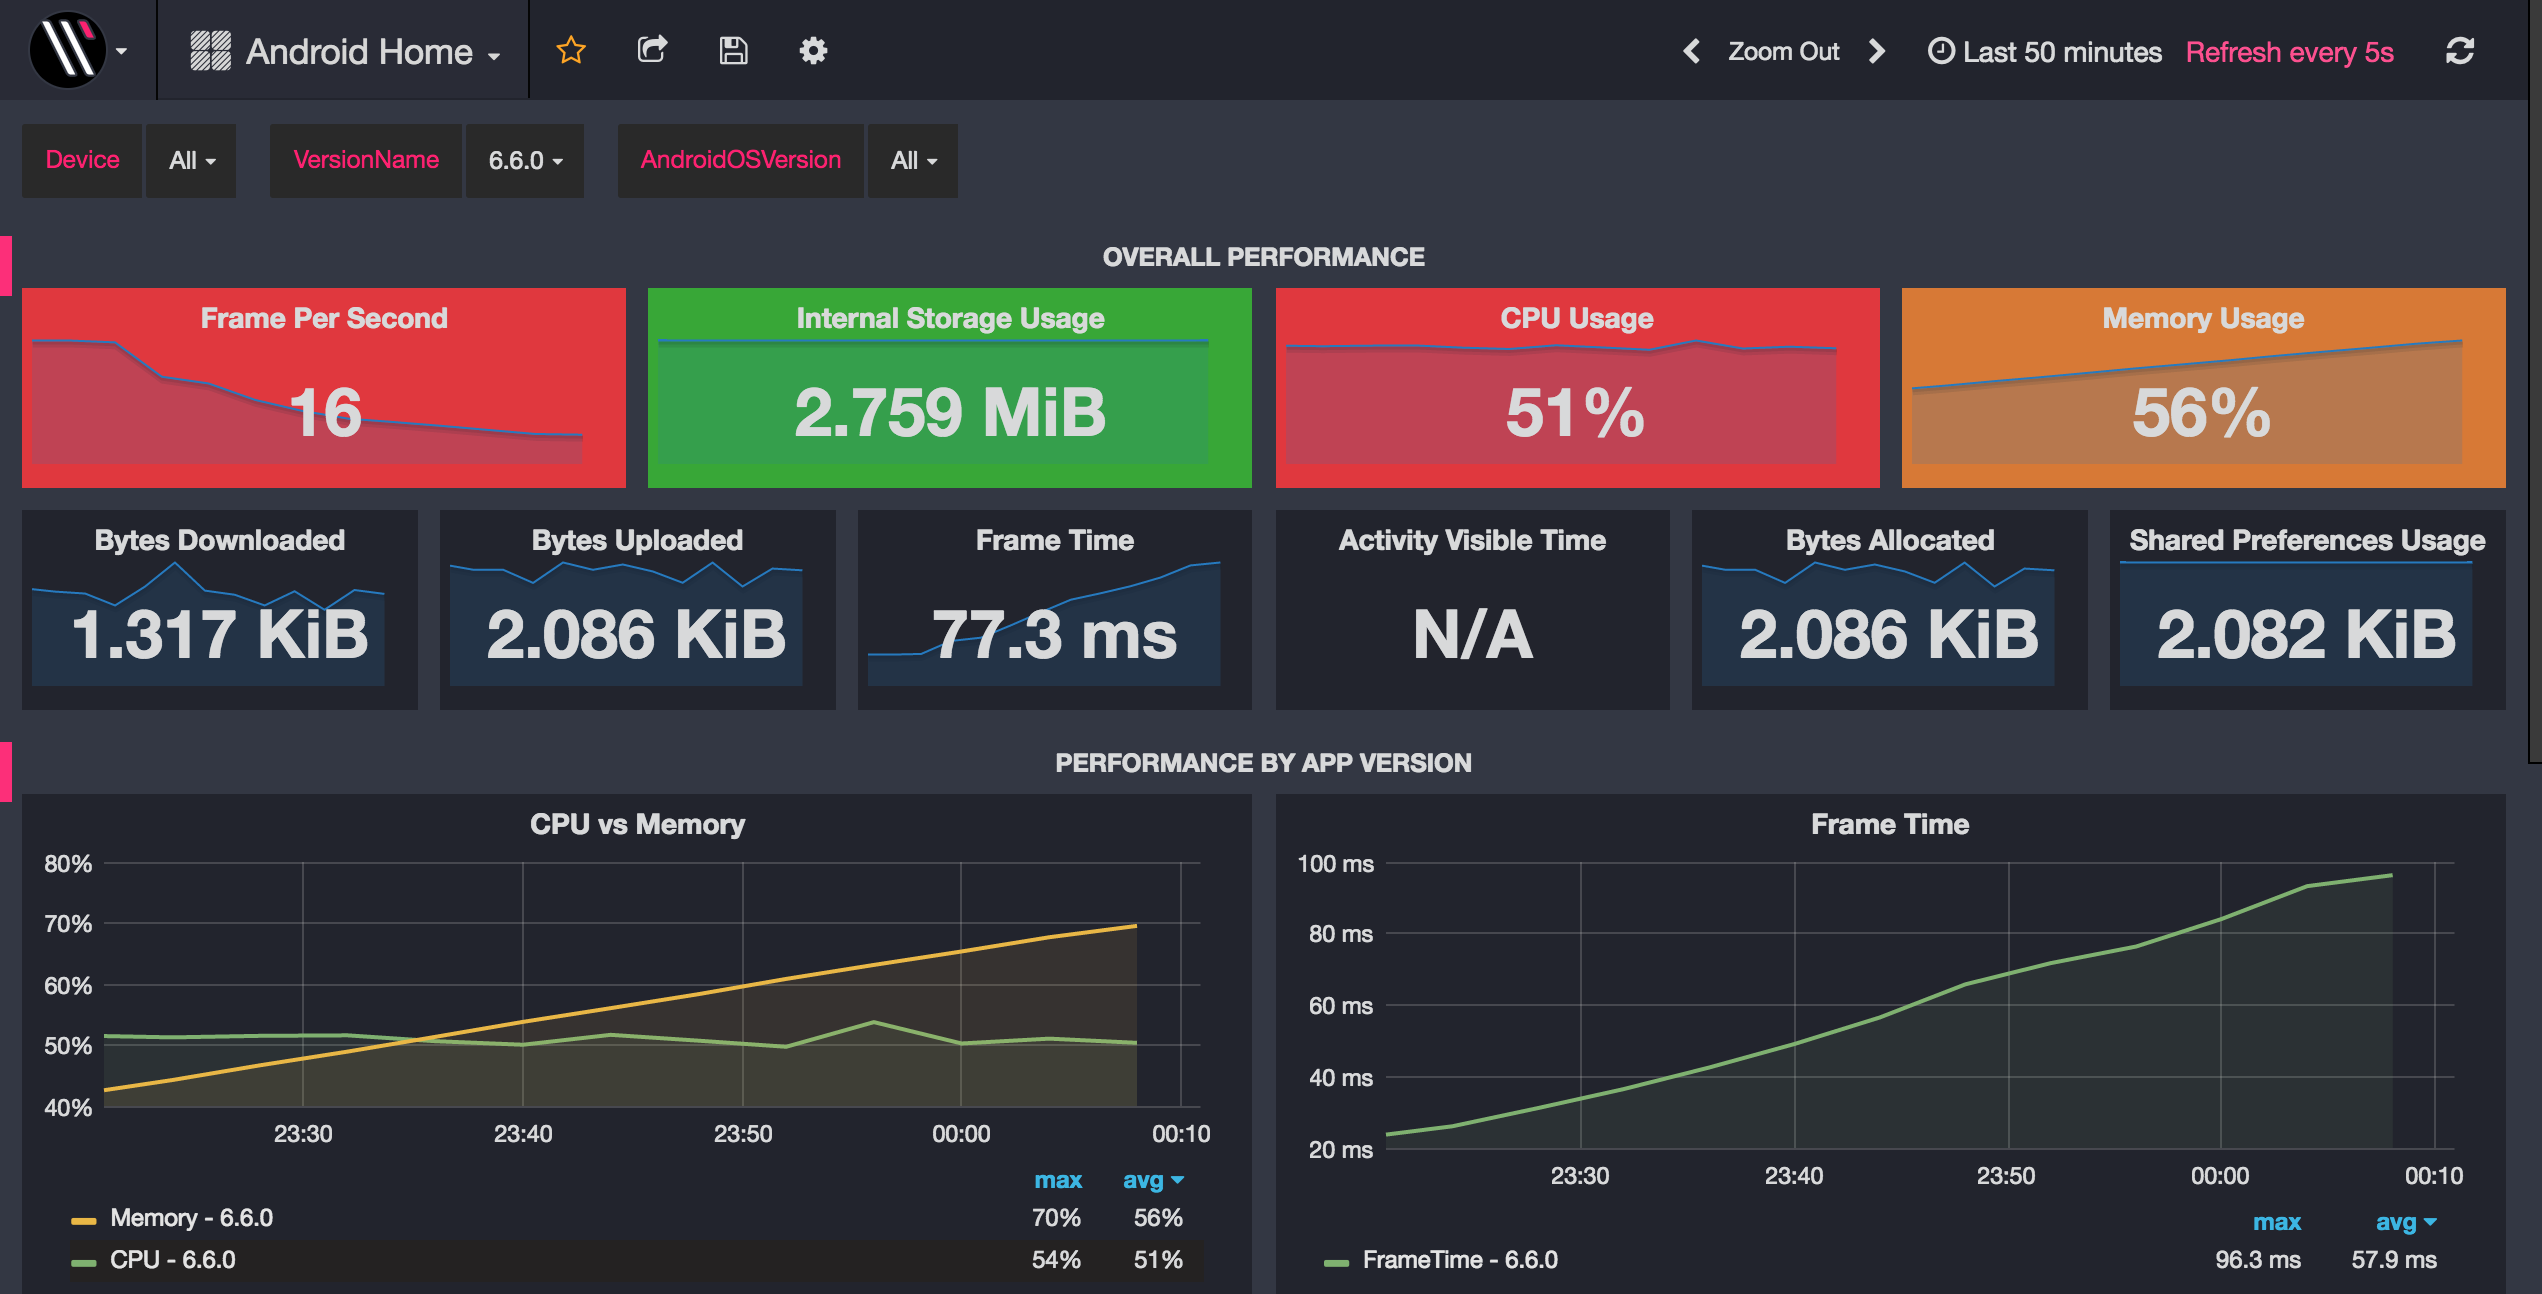
After some time with the app leaking memory - just monitoring the last release, we observed the app performance was a mess. We discovered that the device leaking memory needed almost 100 ms to render a single frame just because of the garbage collection events. The CPU usage was around the 51% and the memory usage about the 56%. The app was surprisingly still alive but it was extremely slow. This fact was really fun and interesting at the same time :) All these performance issues were related to the bug introduced in the audio player custom view.
By leveraging the app performance monitoring platform FlowUp, we were able to timely improve our awareness on how our app really ticked as aid to make a prompt decision that would affect the entire app development pipeline. FlowUp played a critical role in facilitating the decision-making about our development roadmap while also helping us spot and, consequently, fix the bug.
Disclaimer: FlowUp is under continuous development and therefore, the dashboards shown are also still under development. We are about to open our first private beta program. If you wish to have access, please subscribe to our beta program here.